Replacement Pressure Index
Composite Study | Emerging | As of 2026-10-09 | Freshness 194d
Replacement Pressure Index is 'emerging' with a score of 46.2. Child studies are contributing as follows: AI Buildout 47.4, White-Collar Labor 46.2, Productivity-Payroll Gap 60.1.
Component Scores
| Component | Score |
|---|---|
| AI Buildout | 47.37 |
| White-Collar Labor | 46.19 |
| Productivity-Payroll Gap | 60.13 |
Current Drivers
| Driver | Component | Score | Raw | Transformed |
|---|---|---|---|---|
| Semiconductor industrial production | Semiconductor supply tightness | 73.41 | 190.10 | 14.75 |
| Business-sector labor-share proxy | Labor-share squeeze | 100.00 | -3.40 | 950.00 |
| Private fixed investment in intellectual property products | Software and compute capex | 65.42 | 420.07 | 42.05 |
| Professional and business services job openings | Hiring deterioration | 52.16 | 1186.00 | 6.47 |
| Professional and business services hires | Hiring deterioration | 49.55 | 4.20 | 4.55 |
| Continuing unemployment claims | Claims spillover | 48.28 | 1716000.00 | -11.00 |
| Initial unemployment claims | Claims spillover | 47.56 | 197000.00 | -15.45 |
| Private construction spending on power | Power buildout | 51.53 | 165900.00 | 8.36 |
Metrics
| Metric | Value |
|---|---|
| Score | 46.19 |
| Overlay Score | N/A |
| Freshness Days | 194 |
Charts
Composite score history
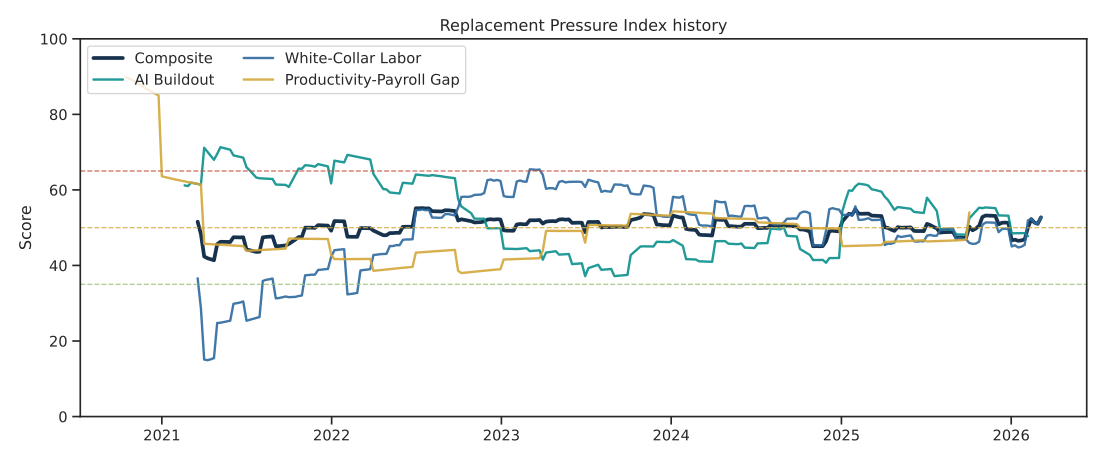
Composite history is built only from child-study score histories and fixed weights.
Current component waterfall
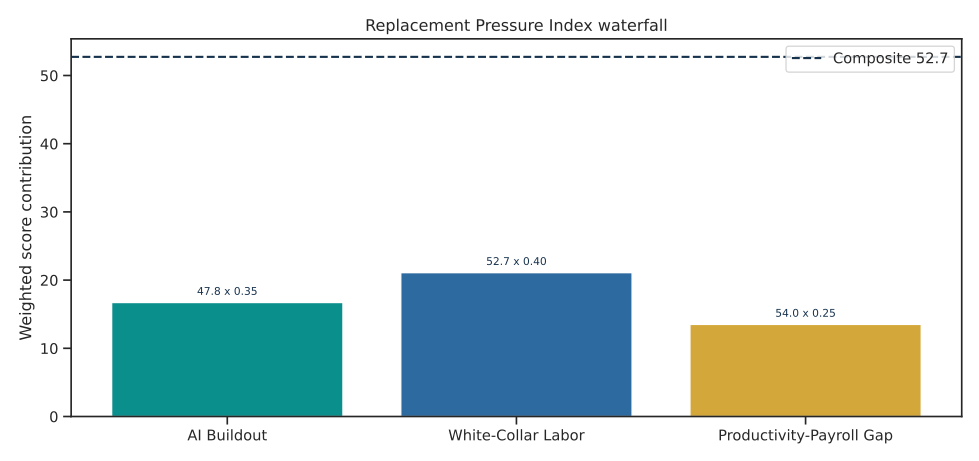
The waterfall shows each child study's weighted contribution to the latest composite score.
Notes
- Higher scores mean AI-enabling buildout, labor softening, and productivity-payroll decoupling are lining up at the same time.
Commentary
Replacement Pressure Index is 'emerging' with a score of 46.2. Child studies are contributing as follows: AI Buildout 47.4, White-Collar Labor 46.2, Productivity-Payroll Gap 60.1.
Deterministic fallback commentary (AI unavailable): - score: 46.1914 - overlay_score: None - component_scores: {'AI Buildout': 47.3749, 'White-Collar Labor': 46.1914, 'Productivity-Payroll Gap': 60.1307} - drivers: [{'label': 'Semiconductor industrial production', 'series_id': 'IPG3344S', 'component': 'Semiconductor supply tightness', 'score': 73.4142, 'transformed_value': 14.7475, 'raw_value': 190.0987, 'from_study': 'AI Buildout', 'composite_impact': 25.695}, {'label': 'Business-sector labor-share proxy', 'series_id': 'PRS85006171', 'component': 'Labor-share squeeze', 'score': 100.0, 'transformed_value': 950.0, 'raw_value': -3.4, 'from_study': 'Productivity-Payroll Gap', 'composite_impact': 25.0}, {'label': 'Private fixed investment in intellectual property products', 'series_id': 'B935RC1Q027SBEA', 'component': 'Software and compute capex', 'score': 65.4241, 'transformed_value': 42.0503, 'raw_value': 420.074, 'from_study': 'AI Buildout', 'composite_impact': 22.8984}, {'label': 'Professional and business services job openings', 'series_id': 'JTS540099JOL', 'component': 'Hiring deterioration', 'score': 52.1608, 'transformed_value': 6.4669, 'raw_value': 1186.0, 'from_study': 'White-Collar Labor', 'composite_impact': 20.8643}, {'label': 'Professional and business services hires', 'series_id': 'JTS540099HIR', 'component': 'Hiring deterioration', 'score': 49.5522, 'transformed_value': 4.5455, 'raw_value': 4.2, 'from_study': 'White-Collar Labor', 'composite_impact': 19.8209}, {'label': 'Continuing unemployment claims', 'series_id': 'CCSA', 'component': 'Claims spillover', 'score': 48.2765, 'transformed_value': -10.9959, 'raw_value': 1716000.0, 'from_study': 'White-Collar Labor', 'composite_impact': 19.3106}, {'label': 'Initial unemployment claims', 'series_id': 'ICSA', 'component': 'Claims spillover', 'score': 47.5638, 'transformed_value': -15.4506, 'raw_value': 197000.0, 'from_study': 'White-Collar Labor', 'composite_impact': 19.0255}, {'label': 'Private construction spending on power', 'series_id': 'PRPWRCONS', 'component': 'Power buildout', 'score': 51.5346, 'transformed_value': 8.3598, 'raw_value': 165900.0, 'from_study': 'AI Buildout', 'composite_impact': 18.0371}] Caveat: This summary is template-based and may miss contextual drivers outside these indicators.